Cost of Solar Power Battery Storage: A 2026 Engineering and Economic Deep-Dive
For project developers, industrial energy managers, and utility planners, the cost of solar power battery storage remains the most decisive factor in investment decisions. Over the past three years, total installed system prices have compressed by 35–40%, yet the composition of costs has shifted dramatically. Hardware (cells, inverters) now represents a smaller share, while balance-of-system (BOS), interconnection, and soft costs dominate. Understanding these granular layers—and how to optimize them—separates bankable assets from stranded investments.
As a vertically integrated energy storage manufacturer, CNTE (Contemporary Nebula Technology Energy Co., Ltd.) delivers industrial storage solutions that directly address the economic drivers of solar-plus-storage projects. This article provides a forensic analysis of the cost of solar power battery storage, covering component-level pricing, levelized cost models, chemistry trade-offs, and practical approaches to improve project returns.
Table of contents cntepower 1 1. Deconstructing the Capital Expenditure (CAPEX) of Solar-Plus-Storage Systems 2 2. Levelized Cost of Storage (LCOS): The True Economic Metric 2.1 2.1 Key Variables Driving LCOS 3 3. Chemistry and System Architecture: Cost Trade-Offs 3.1 3.1 LFP vs. NMC in Solar-Plus-Storage Applications 3.2 3.2 AC vs. DC Coupling: Impact on System Cost 4 4. Operational Expenditure (OPEX) and Revenue Stacking to Offset Costs 5 5. Cost Reduction Trajectories: 2026–2030 Outlook 6 6. Strategies to Optimize Total Cost of Ownership (TCO) 7 7. Conclusion: Moving Beyond Cost to Value 8 Frequently Asked Questions (FAQ) 8.1 Q1: What is the average total installed cost of a solar-plus-storage system in 2026? 8.2 Q2: How does the levelized cost of storage (LCOS) compare to grid electricity prices? 8.3 Q3: What factors most influence the cost of solar power battery storage for industrial facilities? 8.4 Q4: Are there government incentives that reduce the effective cost of storage? 8.5 Q5: How do operations and maintenance costs impact long-term profitability? 8.6 Q6: What is the typical payback period for a solar-plus-storage investment?
1. Deconstructing the Capital Expenditure (CAPEX) of Solar-Plus-Storage Systems
Total installed costs for a utility-scale solar-plus-storage facility (50 MWac solar + 100 MWh storage) vary widely by region, but a 2026 benchmark reveals the following allocation:
Battery packs (cells + modules): 32–38% of total storage system CAPEX. LFP cell prices have stabilized at $95–$110/kWh (cell-level), with module assembly adding $20–$30/kWh.
Power conversion system (PCS) / inverters: 12–15%. Centralized 1500 Vdc inverters now dominate, offering 98.5% efficiency and reduced transformer costs.
Enclosures, thermal management & safety systems: 10–13%. Liquid cooling and fire suppression add upfront cost but lower long-term degradation.
Balance of system (BOS) – civil works, cabling, integration: 18–22%. Containerized skids reduce field labor by 30% compared to stick-built installations.
Grid interconnection & transformers: 8–12%. Medium-voltage switchgear and substation upgrades are often underestimated.
Engineering, permitting, and soft costs: 10–15%. These include grid studies, environmental permits, and project management.
The cost of solar power battery storage at the system level now averages $330–$420/kWh for 4-hour duration utility installations, while commercial & industrial (C&I) behind-the-meter projects (≤2 MWh) see $450–$550/kWh due to smaller scale and higher installation overhead. CNTE’s pre-engineered containerized platforms reduce total installed CAPEX by approximately 15% through standardized design and factory integration testing (FAT).
2. Levelized Cost of Storage (LCOS): The True Economic Metric
Upfront CAPEX alone does not determine viability. The levelized cost of storage (LCOS)—expressed in $/MWh—accounts for capital, operations, replacement, and degradation over the asset’s life. For a 10 MW / 40 MWh solar-coupled system with LFP chemistry, LCOS typically falls between $95 and $135/MWh, depending on cycling frequency and discount rates.
2.1 Key Variables Driving LCOS
Cycle life: LFP systems with 8,000–10,000 cycles at 80% DoD reduce LCOS by 25–30% compared to NMC with 4,000–6,000 cycles.
Round-trip efficiency (RTE): Modern systems achieve 86–90% RTE; every 1% improvement directly lowers LCOS by 2–3%.
Degradation rate: Calendar aging (0.5–1.5% annual capacity loss) and cycling fade must be modeled. Advanced thermal management and state-of-charge (SoC) windows keep degradation below 0.7% per year in CNTE’s monitored deployments.
Operations & maintenance (O&M): Remote monitoring, predictive analytics, and preventive maintenance keep annual O&M at $6–$10/kW-year for utility-scale assets.
When calculating LCOS, financing terms also matter: interest rates of 6–8% can add $15–$25/MWh compared to 4% financing. Projects with strong merchant revenue or contracted off-take achieve lower weighted average cost of capital (WACC), improving competitiveness against gas peakers.
3. Chemistry and System Architecture: Cost Trade-Offs
3.1 LFP vs. NMC in Solar-Plus-Storage Applications
Two battery chemistries dominate the market, each with distinct cost implications over a 15-year asset life.
Lithium Iron Phosphate (LFP): Lower upfront cell cost, superior thermal stability, and 8,000+ cycle life. Ideal for daily cycling (solar firming, peak shaving). Total life-cycle cost per MWh discharged is 20–25% lower than NMC when degradation is factored.
Nickel Manganese Cobalt (NMC): Higher energy density (reduces footprint) but shorter cycle life and higher degradation rates. May be suitable for limited-cycle applications (e.g., backup power, frequency regulation with moderate throughput). However, for solar-paired daily cycling, LFP offers a lower LCOS.
For grid-scale projects, the cost of solar power battery storage based on LFP is now the default choice for over 70% of new contracts in North America and Europe. CNTE’s LFP-based solutions incorporate modular racks with passive cell balancing, enabling consistent performance across the entire fleet.
3.2 AC vs. DC Coupling: Impact on System Cost
Solar-plus-storage can be configured with DC-coupled (storage on the DC side of the solar inverter) or AC-coupled (storage connected to the AC bus via a separate inverter). DC coupling reduces conversion losses by 2–4% and eliminates one inverter stage, lowering CAPEX by 5–8% for new-build projects. AC coupling offers more operational flexibility for retrofits and allows storage to participate in standalone market services. The choice directly influences both upfront expenditure and operational efficiency.
4. Operational Expenditure (OPEX) and Revenue Stacking to Offset Costs
While initial CAPEX dominates early project economics, annual OPEX and revenue diversification are equally important for long-term profitability. Typical OPEX for a 40 MWh system includes:
Remote monitoring and control: $2,500–$4,000 per MW-year.
On-site inspections and preventative maintenance: $3,000–$6,000 per MW-year.
Battery capacity testing (annual): $1,500–$2,500 per MW.
Insurance premiums: 0.3–0.6% of total insured value.
To offset these costs and improve the effective cost of solar power battery storage on a net basis, asset owners increasingly employ revenue stacking:
Energy arbitrage: Charging from solar during midday low-price hours and discharging during evening peak. Margins of $30–$70/MWh in volatile markets like CAISO and ERCOT.
Frequency regulation and ancillary services: Fast-response storage can earn $8–$15/kW-month in markets with high renewable penetration.
Capacity payments: Utilities pay for resource adequacy during peak load periods; typical values $4–$10/kW-month.
Demand charge reduction (C&I): Behind-the-meter systems cut peak demand by 40–60%, saving industrial customers $50–$150/kW annually.
With an optimized energy management system (EMS), a 20 MW / 80 MWh solar-coupled facility can generate annual net revenues of $1.2–$1.8 million after OPEX, achieving payback periods of 6–8 years, even before factoring investment tax credits (ITC) where applicable.
5. Cost Reduction Trajectories: 2026–2030 Outlook
Forecasting the cost of solar power battery storage over the next five years reveals continued but slower declines compared to the 2015–2023 period. Key drivers:
Cell commoditization: LFP cell prices are expected to reach $70–$85/kWh by 2028, driven by manufacturing scale and raw material stabilization (lithium carbonate below $15,000/ton).
Integration savings: Standardized 5 MWh+ containerized systems reduce BOS by 12–18% through fewer interconnects and simpler logistics.
Digital twin and AI O&M: Predictive maintenance reduces unplanned downtime by 30–40%, lowering OPEX and extending asset life.
Second-life battery use: Repurposed EV batteries could serve low-cycling applications at 40–50% lower upfront cost, though standardization remains a barrier.
By 2030, the levelized cost of solar-plus-storage is projected to fall below $60/MWh in sunny regions, undercutting new-build combined-cycle gas plants without subsidies. CNTE’s manufacturing roadmap includes next-generation LFP cells with 12,000-cycle capability, directly reducing LCOS for high-throughput applications.
6. Strategies to Optimize Total Cost of Ownership (TCO)
For utilities and large commercial entities, minimizing TCO goes beyond selecting the lowest bid. Engineering choices made early in the project lifecycle have disproportionate impact.
Right-sizing storage duration: 4-hour systems are optimal for peak shaving and solar firming in most markets. Over-sizing beyond the optimal energy/power ratio inflates costs without proportional revenue.
Standardized modular designs: Deploying 2.5 MWh or 5 MWh containers with common electrical interfaces enables phased investment and reduces spare part inventory.
Warranty and performance guarantees: Insist on liquidated damages for capacity fade. CNTE offers 15-year performance warranties with 80% end-of-term capacity retention, providing bankability for project financing.
Local content and supply chain resilience: Sourcing cells and modules from vertically integrated manufacturers reduces logistics costs and tariff exposure.
With careful procurement and system design, the cost of solar power battery storage can be reduced by 10–18% compared to fragmented vendor approaches.
7. Conclusion: Moving Beyond Cost to Value
Analyzing the cost of solar power battery storage today requires a holistic view—one that accounts for total installed CAPEX, LCOS, revenue potential, and long-term operational risk. The industry has matured to a point where storage paired with solar is not merely an environmental choice but a financially superior alternative to fossil generation in many regions. CNTE combines advanced LFP engineering, factory-integrated containers, and lifecycle support to deliver some of the most competitive levelized costs in the market. As raw material markets stabilize and technology continues to advance, the economic case for solar-plus-storage will only strengthen, making it a cornerstone of modern energy infrastructure.
Frequently Asked Questions (FAQ)
Q1: What is the average total installed cost of a solar-plus-storage system in 2026?
A1: For utility-scale projects (≥20 MW / ≥80 MWh), total installed costs range from $330 to $420 per kilowatt-hour (kWh) of storage. Commercial and industrial behind-the-meter systems (100 kW–2 MW) typically cost $450–$550/kWh. These figures include battery modules, inverters, enclosures, installation, and soft costs but vary by region and interconnection complexity.
Q2: How does the levelized cost of storage (LCOS) compare to grid electricity prices?
A2: LCOS for 4-hour duration LFP systems now ranges from $95 to $135/MWh, depending on cycle frequency and financing. In markets with high solar penetration (e.g., California, Texas, Australia), daytime wholesale electricity prices can fall below $20/MWh, while evening peak prices exceed $150/MWh, creating arbitrage margins of $80–$120/MWh. Combined with ancillary service revenues, solar-plus-storage often achieves net positive cash flow within 6–9 years.
Q3: What factors most influence the cost of solar power battery storage for industrial facilities?
A3: Key cost drivers for C&I installations include: (1) system size—larger projects benefit from economies of scale; (2) site-specific engineering—rooftop vs. ground-mount, electrical infrastructure upgrades; (3) battery chemistry—LFP offers lower lifecycle cost; (4) local permitting and utility interconnection fees; and (5) project financing terms. CNTE’s standardized 1 MWh–10 MWh containerized solutions streamline these variables, reducing engineering overhead by up to 25%.
Q4: Are there government incentives that reduce the effective cost of storage?
A4: Yes. In the United States, the Investment Tax Credit (ITC) for solar-plus-storage projects qualifies for 30% of total project cost if storage is charged at least 75% from solar. Similar programs exist in Europe (e.g., EU Innovation Fund), Australia (state-level battery subsidies), and parts of Asia. ITC or direct grants can reduce net CAPEX by 20–40%, significantly accelerating payback. Project developers should consult local tax and incentive experts to optimize stacking.
Q5: How do operations and maintenance costs impact long-term profitability?
A5: O&M typically accounts for 15–20% of total lifecycle costs. Annual O&M for a 40 MWh system ranges from $80,000 to $150,000, covering remote monitoring, preventative maintenance, and periodic testing. Advanced predictive analytics can reduce unplanned maintenance by 30% and extend battery useful life. CNTE’s O&M packages include 24/7 remote monitoring and guaranteed uptime, ensuring consistent revenue generation over the asset’s lifetime.
Q6: What is the typical payback period for a solar-plus-storage investment?
A6: For utility-scale projects with contracted revenues (e.g., power purchase agreements + capacity payments), payback periods range from 6 to 9 years. Merchant projects relying on wholesale market arbitrage may see 8–11 years, depending on volatility. C&I systems that capture demand charge savings and net metering benefits often achieve payback in 5–8 years. The cost of solar power battery storage continues to decline, shortening these periods across segments.
For detailed project modeling, system specifications, or to explore how to optimize your storage investment, visit CNTE or review their comprehensive cost of solar power battery storage solutions designed for industrial and utility applications.
Get in Touch
Recent Posts
-
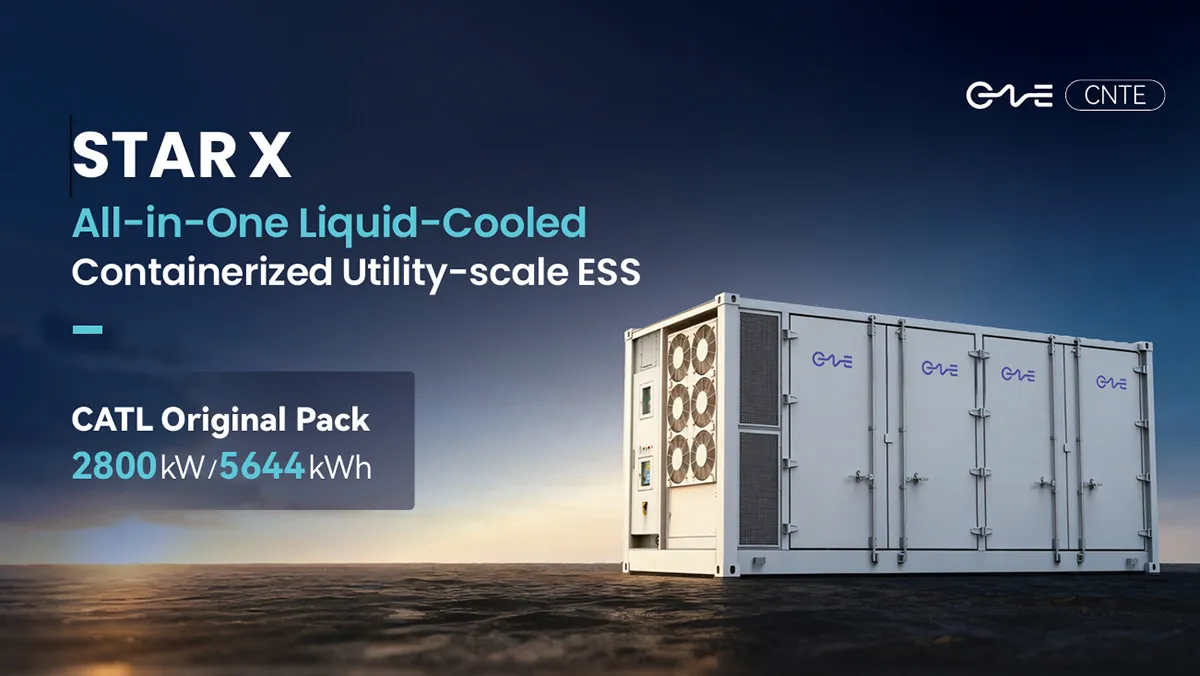
CNTE Launches STAR X Liquid-Cooled DC/AC Integrated Energy Storage System at Intersolar Europe 2026
Jul 06, 2026 -
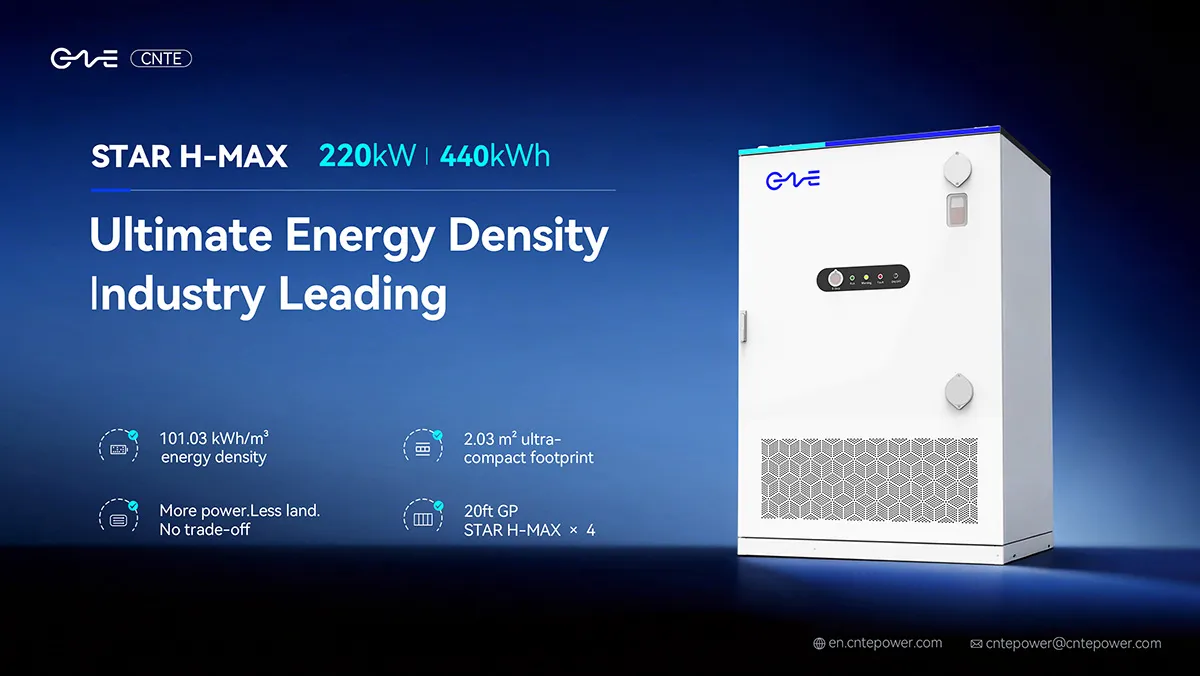
CNTE Unveils New STAR H-MAX Liquid-Cooled C&I ESS at Intersolar Europe 2026
Jun 23, 2026 -
CNTE to Participate in Intersolar Europe 2026
May 20, 2026 -
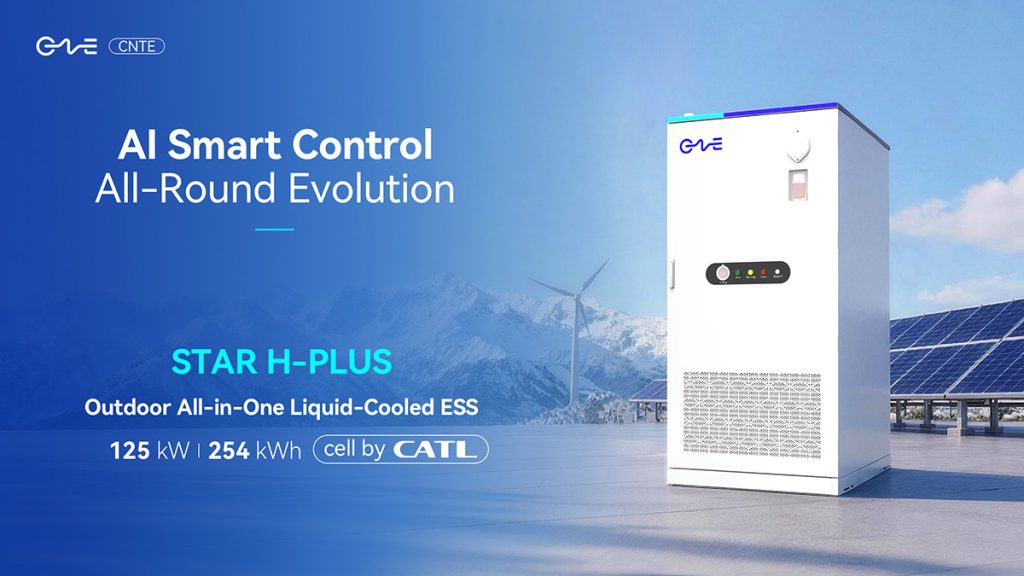
CNTE at KEY ENERGY 2026: Showcases STAR H-PLUS Outdoor Liquid-Cooled Energy Storage System
Mar 05, 2026 -

CNTE Honored as 2025 Forbes China Leading Global Brand
Jul 06, 2026 -

CNTE & YOU.ON Partner to Expand Storage Markets
May 19, 2025 -

CNTE Unveils Energy Storage Lineup at Solartech 2025
May 19, 2025 -
CNTE awarded AEO certification
Jul 06, 2026 -
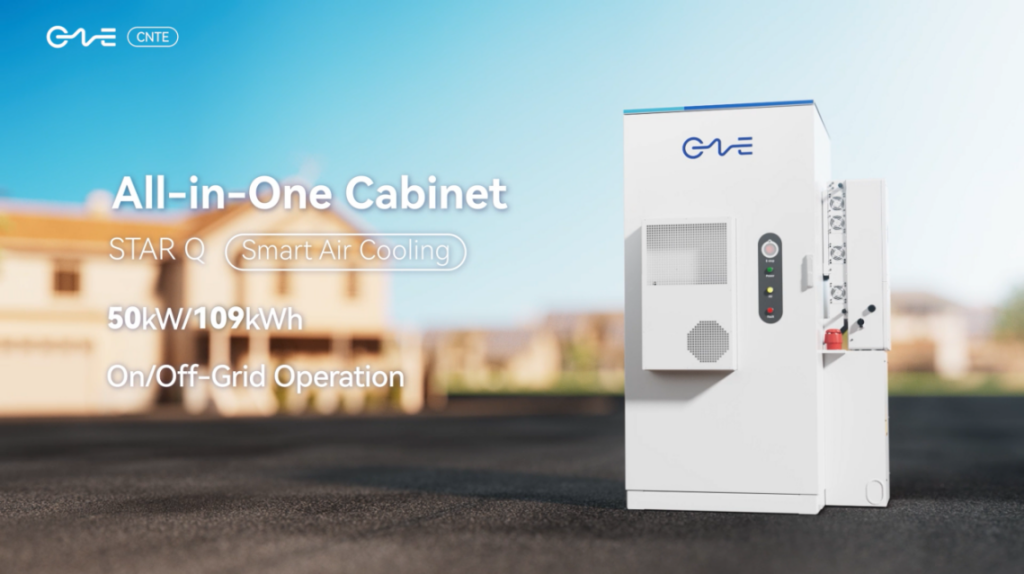
CNTE New Product Launch STAR Q
Jan 15, 2025 -
CNTE Named to Forbes China 2024 Top 30 Go-International Brands
Jul 06, 2026