
Large Scale Battery Energy Storage Systems: Capacity, Control, and Economic Performance
The composition of generation fleets has shifted decisively toward variable renewable sources. Wind and solar now account for more than 25% of annual electricity production in several major economies, with that share continuing to rise. This transition introduces a fundamental operational challenge: the instantaneous balance between generation and load must be maintained within narrow frequency boundaries (typically ±0.05 Hz) at all times. Conventional synchronous generators provide inertia and frequency response through their rotating masses, but inverter-based resources do not inherently offer those properties. Large scale battery energy storage systems have become the preferred response to this deficit, delivering power at millisecond-scale latency and with energy capacities that now exceed 4 GWh per project site. The engineering decisions made during system design directly affect project viability across a 20-year operational horizon.
Core Technology Selection and System Integration
The performance envelope of any storage installation is determined by the interplay of cell chemistry, power conversion topology, and thermal regulation. Each element imposes constraints that ripple through the entire project life cycle.
Cell Chemistry and Form Factor Considerations
Lithium iron phosphate (LFP) cathodes dominate the utility-scale segment. The reasons extend beyond cost—LFP cells exhibit onset temperatures for thermal runaway above 270°C, compared to approximately 180°C for nickel-manganese-cobalt (NMC) variants. This margin simplifies fire protection and permits denser container packing. Cycle life figures for premium LFP products range from 6,000 to 8,000 full-equivalent cycles to 80% state-of-health, with some suppliers guaranteeing 10,000 cycles under controlled duty cycles. The energy density penalty (roughly 25% lower than NMC) matters less for stationary applications, where footprint constraints are secondary to operational longevity. Prismatic and pouch formats have been optimized for passive cooling paths and uniform pressure distribution across electrodes, reducing the risk of lithium plating during high-rate charging. Pack-level energy density for current generation LFP systems settles between 180-200 Wh/kg, providing sufficient compactness for most substation and brownfield deployment sites.
Power Conversion and Grid-Forming Control
The interface between the battery DC bus and the AC grid relies on multilevel converter topologies. Three-level neutral-point clamped (NPC) and flying capacitor designs have become standard, achieving conversion efficiencies above 98.5% across a 20% to 100% load band. Grid-forming capability represents a distinguishing feature for modern installations. In grid-forming mode, the inverter synthesizes an AC voltage reference internally, allowing the storage asset to establish frequency and phase angle independently. This mode becomes increasingly necessary as synchronous generation retires—without grid-forming resources, systems with high inverter penetration experience reduced damping of electromechanical oscillations. Large scale battery energy storage systems equipped with grid-forming inverters can provide virtual inertia and transient stability support, services that were previously exclusive to rotating machinery. Reactive power compensation ranges of ±0.9 leading to ±0.9 lagging are now routinely specified, enabling voltage regulation concurrent with active power injection or absorption.
Thermal Regulation Approaches
Heat accumulation during charge and discharge cycles accelerates capacity fade through several mechanisms: SEI layer growth, lithium inventory loss, and increased internal resistance. Air-cooling systems, while simpler, struggle to maintain cell-to-cell temperature differentials below 4-6°C under sustained high-power operation. Liquid cooling has gained broad acceptance, providing heat transfer coefficients five to eight times higher than forced air. Direct liquid immersion cooling, where cells are submerged in dielectric fluid, further reduces differentials to under 1.5°C, thereby eliminating hotspots that cause non-uniform aging. The thermal management subsystem typically accounts for 8-12% of total capital expenditure, but the extended cycle life—often two to three additional years—delivers a positive net present value for most project financial models. Active cooling power consumption ranges from 3-4% of system output for hybrid designs (liquid cooling combined with phase-change material buffers) compared to 6-8% for purely air-based approaches.
Application Value Streams and Operational Modes
Revenue generation for storage assets depends on the ability to participate in multiple market segments. The weighting of these applications determines the required duration, power rating, and cycling intensity.
Frequency Regulation and Reserve Markets
Primary frequency response (PFR) and automatic frequency restoration reserve (aFRR) provide the highest per-MW revenue in many wholesale markets. Response time windows for PFR are 30 seconds or less—a specification that storage meets with significant margin. A 100 MW battery can reach full rated power within 180 milliseconds from standby, while gas turbines require 2-5 minutes for synchronization and ramping. This speed advantage translates to compensation rates of $15-25 per MW per hour of availability in European and North American markets. The duty cycle for regulation tends to be shallow, with depth-of-discharge rarely exceeding 10-20%. This operating pattern preserves cycle life while generating steady monthly cash flow. Storage-only projects dedicated to frequency regulation have demonstrated internal rates of return above 15% in well-designed market environments.
Energy Arbitrage and Peak Load Management
Wholesale electricity prices exhibit daily and seasonal patterns driven by demand cycles and renewable output profiles. In markets such as CAISO and ERCOT, the spread between midday (solar-rich) prices and evening peak prices frequently exceeds $60/MWh. A storage system with 4-hour duration can charge during low-price windows and discharge into peak periods, capturing gross margins of $45-50/MWh after accounting for round-trip losses. Behind-the-meter peak shaving reduces demand charges for industrial consumers—facilities with monthly peak demand above 10 MW often achieve 25-35% reductions in their demand charge component, with payback periods under four years for systems sized to cover the top 20% of peak load. Energy arbitrage typically employs cycles of 60-80% depth-of-discharge, which accelerates degradation compared to regulation duty, so projects must calibrate cycling frequency against replacement cost assumptions.
Renewable Integration and Output Smoothing
Co-located storage with wind and solar farms addresses the ramp rate constraints imposed by grid operators. Uncontrolled photovoltaic output can change at rates of 40-50% per minute due to cloud cover, causing voltage flicker and frequency excursions. Pairing a 4-hour battery with a 100 MW solar array reduces ramp rates to under 5% per minute, meeting the most stringent interconnection requirements. The storage asset also shifts production into higher-value evening hours—a 2-3 hour extension of deliverable capacity improves project revenues by 15-20% compared to solar-only plants. Hybrid projects now represent the default configuration for new utility-scale renewable developments across the southwestern United States and parts of Asia, where LFP-based storage has become the standard pairing for photovoltaic sites.
Operational Challenges and Mitigation Strategies
Despite proven performance, several persistent issues affect the reliability and economics of storage projects. Systematic engineering responses have been developed for each.
Degradation Pathways and Lifetime Extension
Capacity loss proceeds through calendar aging and cyclic aging, each driven by distinct variables. Calendar aging—the irreversible loss of active lithium—correlates strongly with average state-of-charge and ambient temperature. Storing cells at 100% SOC and 35°C accelerates calendar fade by a factor of three compared to 50% SOC at 25°C. Cyclic aging depends on depth-of-discharge and charge/discharge rate (C-rate). Full 1C cycles produce roughly 40% more capacity fade per equivalent megawatt-hour throughput than 0.5C cycles. Many projects adopt 0.25C to 0.5C system configurations for arbitrage applications, accepting higher upfront capacity costs in return for extended operational life. The degradation trajectory is nonlinear—most chemistries show accelerated fade beyond 70% state-of-health, making mid-life repowering decisions an economic exercise that balances new cell costs against remaining capacity value.
Safety Systems and Thermal Event Prevention
Thermal runaway, while rare, remains the foremost safety concern. Prevention layers operate at cell level (LFP’s high onset temperature), module level (flame-retardant separators and pressure-relief vents), and system level (aerosol-based or water-mist fire suppression). NFPA 855 provides prescriptive spacing and ventilation requirements, while UL 9540A testing validates the effectiveness of propagation barriers. Modern installations above 50 MW include distributed temperature sensing at each module, with automatic shutdown sequences triggered when any cell exceeds 60°C. These safety additions contribute 5-8% to project capital costs but are mandatory for permitting and insurance underwriting. Alarm and fault logs are archived for root-cause analysis, enabling continuous refinement of protection algorithms.
Grid Interconnection and Compliance Testing
Connecting a 100 MW asset to the transmission network requires demonstrating compliance with IEEE 1547-2018, UL 9540, and regional utility-specific requirements. Interconnection studies evaluate harmonic distortion (held below 5% total demand distortion), frequency ride-through (the ability to remain connected during under/over frequency transients), and reactive power capability at 0.9 power factor. Dynamic simulation models must be validated against hardware test results—the process typically spans 12-18 months and consumes 3-5% of the project development budget. System integrators that maintain pre-certified designs for multiple grid jurisdictions reduce this timeline materially. CNTE (Contemporary Nebula Technology Energy Co., Ltd.) incorporates pre-validated switchgear and control interfaces for major regional transmission organizations, shortening the interconnection approval cycle by an average of six months.
Performance Optimization Methods
Operational excellence requires refinement across several domains. The following practices have demonstrated measurable benefits in field deployments.
State Estimation Using Machine Learning
Conventional coulomb-counting methods for state-of-charge (SOC) and state-of-health (SOH) suffer from cumulative errors that reach 5-8% over extended operation. Modern battery management systems now incorporate extended Kalman filters or recurrent neural networks that process current, voltage, and temperature data at 10-100 Hz sampling rates. These models reduce SOC estimation error to under 2% and SOH error to under 3%. Accurate state knowledge enables more aggressive yet safe operating limits, unlocking an additional 5-7% of usable capacity from the same physical cells. The BMS also coordinates passive and active balancing to prevent voltage drift across modules, which would otherwise reduce effective capacity by 10-15% annually in the absence of intervention.
Hybrid Cooling and Thermal Buffering
Combining liquid cooling for power electronics and cell tabs with phase-change materials (PCMs) for thermal buffering produces superior results compared to either approach in isolation. PCMs with melting points around 40-45°C absorb heat during peak discharge intervals and release it during idle periods, reducing peak cooling loads by 30%. This architecture lowers parasitic energy consumption for thermal regulation to 3-4% of system output versus 6-8% for air-cooled designs. Multiple projects exceeding 200 MW have adopted this hybrid design, reporting round-trip efficiency gains of 2.5 percentage points. The improved efficiency directly increases arbitrage margins and reduces the required charging energy for a given discharge output.
Predictive Diagnostics and Condition Monitoring
Distributed sensors measuring voltage, temperature, strain, and gas composition enable predictive models that identify emerging faults before they cause outages. A 15-20% increase in internal resistance typically precedes cell failure by several weeks, providing sufficient lead time for scheduled replacement during planned maintenance windows. Projects equipped with predictive diagnostics report availability rates above 98%, versus industry averages of 94-96%. The value of this availability improvement is substantial—for a 150 MW asset, a 4% increase in uptime translates to additional annual revenue of $1.2-2.0 million, depending on market price realizations. The diagnostic algorithms are refined over time using field data, creating a learning loop that improves fault prediction accuracy with each operational year.
Economic Framework for Project Assessment
Financial viability depends on accurate modeling of capital costs, operating expenses, degradation, and revenue stream interactions.
Installed Cost Structure
Turnkey installed prices for large scale battery energy storage systems currently range from $250-350 per kWh for 4-hour duration projects. This figure encompasses cells, racks, power conversion equipment, thermal management, BMS, and labor. Balance-of-plant items—civil works, grid connection transformers, and site preparation—add $50-80 per kWh for greenfield sites. Annual operational expenditures average $8-12 per kW, covering maintenance, insurance, and scheduled replacement parts. The declining cost trend has moderated due to lithium carbonate price fluctuations, but LFP raw material availability remains sufficient for projected global deployments of 40-50 GW annually through 2030.
Levelized Cost of Storage (LCOS) Calculations
LCOS models must integrate cycle life, efficiency losses, discount rates, and degradation curves. A reference 100 MW/400 MWh LFP system with 8,000 cycles, 89% round-trip efficiency, and a 20-year financial horizon produces LCOS values of $95-115 per MWh discharged. Sensitivity analysis shows that discount rate and annual throughput are the most influential variables—each 1% increase in discount rate raises LCOS by about $4 per MWh, while each additional 1,000 cycles over the system lifetime reduces LCOS by $6-8 per MWh. CNTE's engineering focus on extending cycle life through optimized charge/discharge protocols and temperature management directly improves the LCOS position for its utility partners.
Revenue Stacking and Energy Management
Projects achieve highest returns when stacking multiple revenue streams concurrently. A representative allocation might assign 40-50% of capacity to frequency regulation, 30-35% to energy arbitrage, and the remainder to capacity payments or renewable firming. Stacking raises internal rates of return by 8-12 percentage points compared to single-application designs. The energy management system (EMS) executes this allocation using mixed-integer linear programming that optimizes against real-time price signals, grid conditions, and battery state. Installations with advanced EMS implementations generate 15-20% higher total revenue than those with fixed rule-based schedulers. The EMS must also account for degradation costs in its optimization objective—frequent deep cycling for arbitrage may produce higher immediate revenue but shortens useful life, so the trade-off is explicitly modeled in the dispatch algorithm.
Frequently Asked Questions
What is the expected operational lifetime of a utility-scale battery installation?
Most large scale battery energy storage systems with LFP chemistry provide 6,000-8,000 full-equivalent cycles to 80% state-of-health, corresponding to 18-22 years of operation under typical duty cycles. Calendar aging under controlled temperatures (20-25°C) limits lifespan to approximately 20-22 years even if cycling is infrequent. Actual field performance depends on average depth-of-discharge and ambient conditions—assets operated at 50-60% DoD may exceed 10,000 cycles, whereas those cycling at 90% DoD experience accelerated fade.
How do battery storage projects compare to pumped hydro for grid services?
Pumped hydro provides 8-12 hours of duration and per-kWh capital costs that are lower at very large scales (>1 GWh). However, response times are 2-5 minutes due to turbine inertia and water column acceleration. Battery systems respond in under 200 milliseconds, making them superior for frequency regulation. Round-trip efficiency for pumped hydro ranges 75-80%, while modern LFP systems achieve 85-92%. Battery systems also offer modular deployment, shorter construction timelines, and far fewer geographical constraints than pumped hydro.
What standards govern safety and interconnection for large installations?
Primary certifications include UL 9540 (system safety), UL 9540A (thermal propagation testing), IEEE 1547-2018 (interconnection), and NFPA 855 (installation and fire protection). Regional grid operators impose additional dynamic performance requirements, such as fault ride-through and reactive power capability curves. Projects typically undergo a hazard mitigation analysis during permitting, which must demonstrate compliance with all applicable fire codes and environmental regulations.
Can these systems operate independently during a grid disturbance?
Islanded operation requires grid-forming inverters with black-start functionality, which is not included in all installations. Systems designed for islanding can disconnect from the main grid and sustain local loads, but duration is limited by the battery's energy capacity. Most transmission-connected projects prioritize grid support over backup function and do not include islanding features, as they add cost and control complexity without providing revenue in normal markets.
How does climate affect system performance and reliability?
Ambient temperatures outside the 10-40°C range reduce usable capacity and accelerate degradation. Below 10°C, internal resistance rises, reducing available capacity by 10-15% and lowering discharge voltage. Above 40°C, calendar aging doubles for each 10°C increase beyond 25°C. Thermal management systems maintain cells within the 20-35°C band irrespective of external conditions. Containerized installations in hot climates require enhanced cooling capacity, while cold-region projects include heating elements to maintain minimum operating temperatures.
What is the carbon footprint of producing a utility-scale storage system?
Manufacturing emissions for LFP systems currently range 60-100 kg CO2-equivalent per kWh of capacity, with cathode production and cell assembly dominating the total. Over a 20-year life and 8,000 cycles, this amortizes to approximately 12-15 g CO2-equivalent per kWh discharged. In comparison, a natural gas peaker plant emits 400-500 g CO2/kWh, so battery storage displaces over 90% of greenhouse gas emissions when replacing fossil peaking capacity.
For project-specific engineering studies, capacity configuration recommendations, or economic modeling tailored to your market and application, direct inquiries to the CNTE (Contemporary Nebula Technology Energy Co., Ltd.) commercial engineering desk. Please provide the proposed project capacity, location, desired duration, and primary application—whether frequency regulation, arbitrage, or renewable integration—to receive a preliminary feasibility assessment within five business days. Comprehensive proposals, including system layouts, one-line diagrams, and LCOS projections, are issued following site-specific data collection. Contact the engineering team at cntepower@cntepower.com to initiate the review process.
Get in Touch
Recent Posts
-
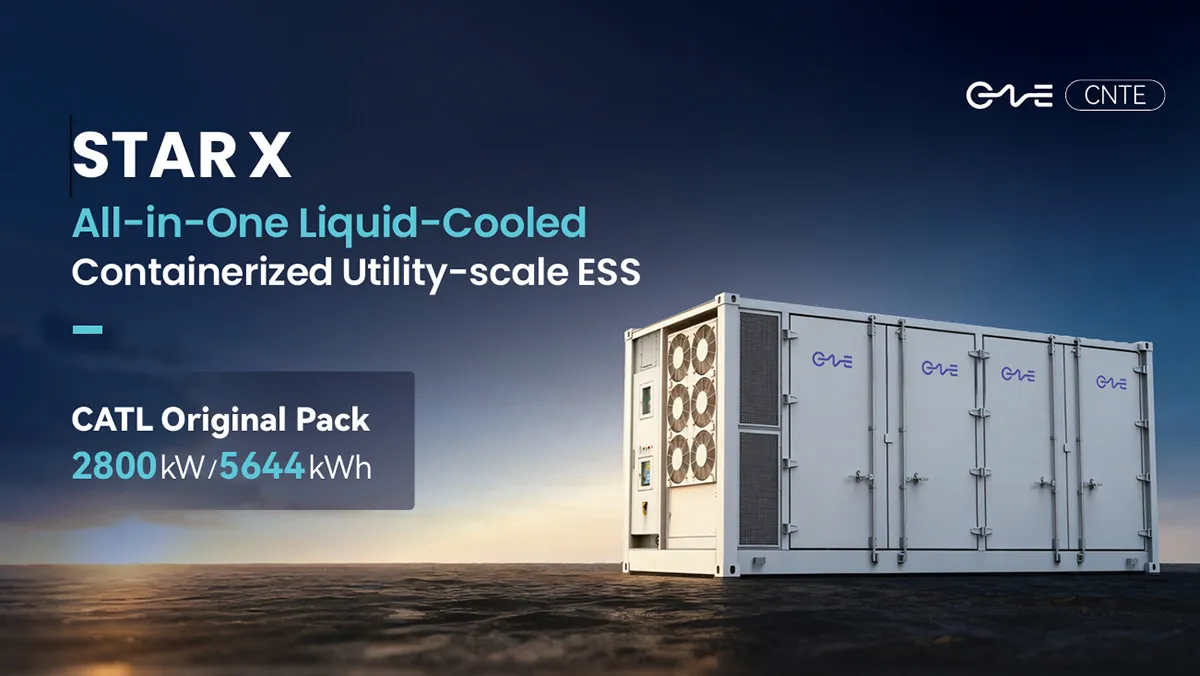
CNTE Launches STAR X Liquid-Cooled DC/AC Integrated Energy Storage System at Intersolar Europe 2026
Jul 06, 2026 -
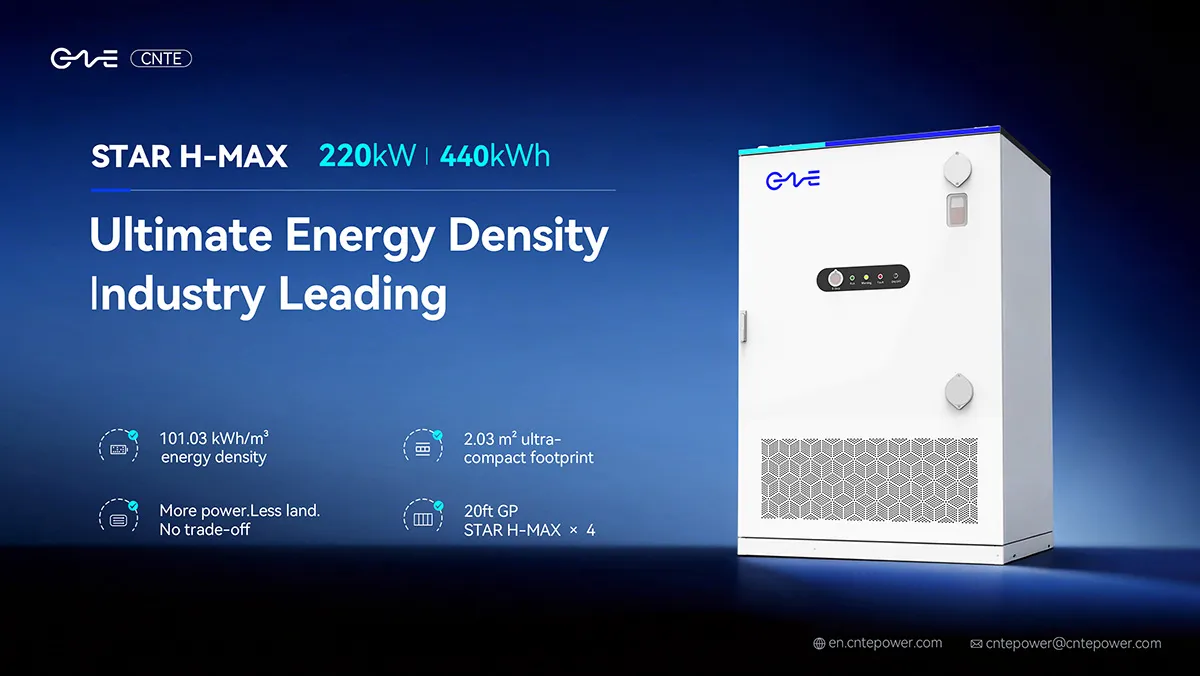
CNTE Unveils New STAR H-MAX Liquid-Cooled C&I ESS at Intersolar Europe 2026
Jun 23, 2026 -
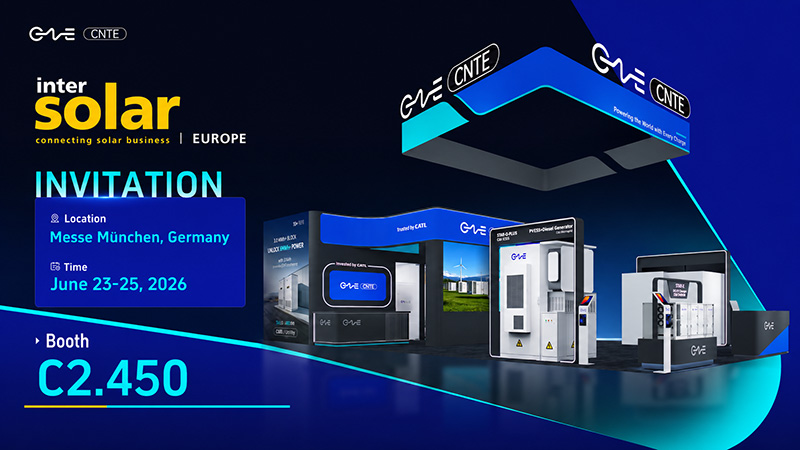
CNTE to Participate in Intersolar Europe 2026
May 20, 2026 -
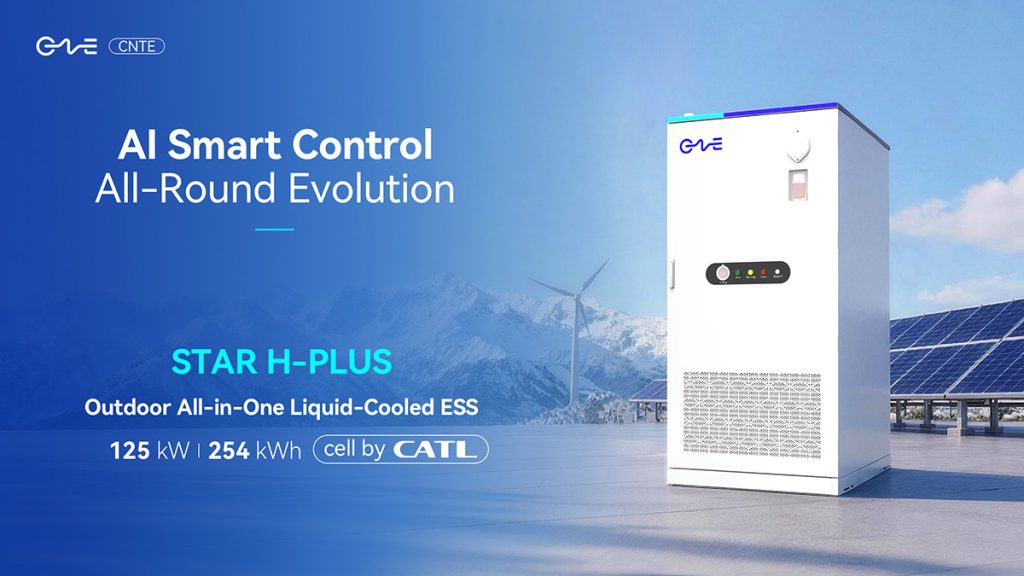
CNTE at KEY ENERGY 2026: Showcases STAR H-PLUS Outdoor Liquid-Cooled Energy Storage System
Mar 05, 2026 -

CNTE Honored as 2025 Forbes China Leading Global Brand
Jul 06, 2026 -

CNTE & YOU.ON Partner to Expand Storage Markets
May 19, 2025 -

CNTE Unveils Energy Storage Lineup at Solartech 2025
May 19, 2025 -

CNTE awarded AEO certification
Jul 06, 2026 -
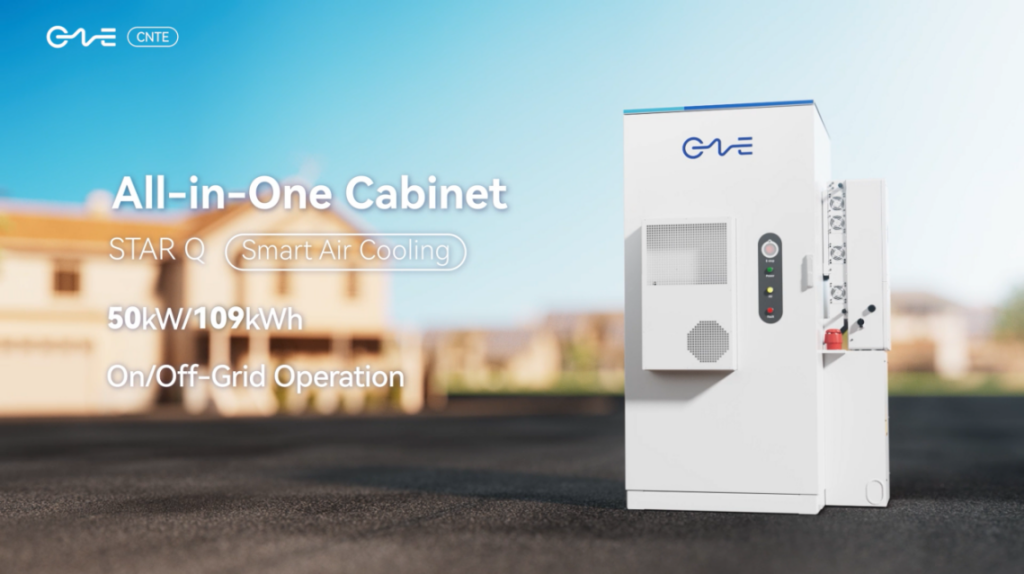
CNTE New Product Launch STAR Q
Jan 15, 2025 -

CNTE Named to Forbes China 2024 Top 30 Go-International Brands
Jul 06, 2026
